Corralito in American Bonds
Dissecting the greatest heist in financial markets history
Part I — The Iceberg and Its Hidden Layers · 120 million short shares in TLT, invisible synthetic sales, and the anatomy of the most massive bearish bet in modern history against U.S. sovereign debt.
Introduction: When the "Risk-Free Asset" Starts Charging Admission
There is a brutal irony in the American bond market data in March 2026. The instrument that for eighty years was the global capital sanctuary — U.S. sovereign debt —, the "riskless asset" upon which all the planet's valuation models were built, is being bet against massively, systematically and at a scale without precedent in modern financial history.
And not by garage speculators with an Interactive Brokers account. By the same sovereign funds, institutional managers and former petrodollar allies who for decades financed the American deficit buying those bonds. The difference between 2015 and 2026 is that now they are not selling the physical — they are shorting it through the back door, using derivatives, ETFs and dark pools, while maintaining the appearance of loyalty in the Treasury's official data.
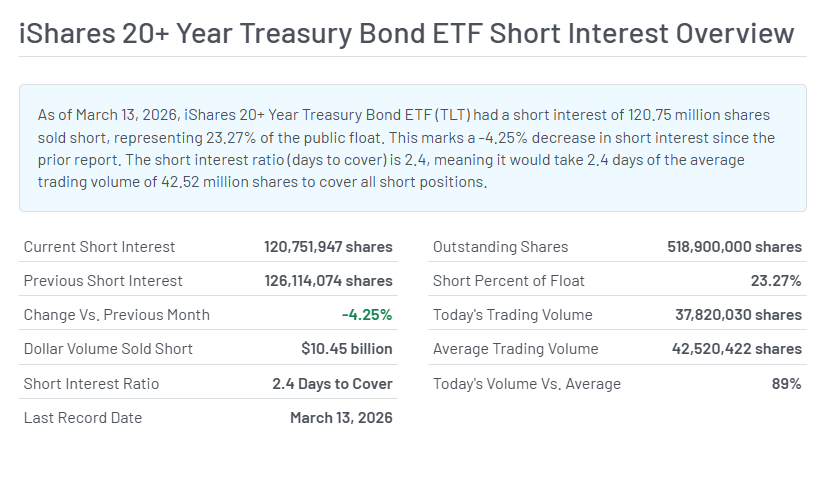
Opening Data — March 13, 2026
120.75M
Short shares in TLT23.27%
% of float shorted$10.45B
Short notional in TLT (USD)2.4d
Days to Cover (DTC)
But that number — $10.45 billion bet against the longest American bond — is only the tip of the iceberg emerging above the surface. Below, in the dark waters of dark pools, OTC swaps and put options on ETFs, there is selling pressure that multiplies that figure by 3 to 5 times. And on top of all that, in the Treasury futures market, speculative funds (leveraged funds from the CFTC COT report) maintain net short positions equivalent to between 300 and 800 billion dollars in notional — twenty to fifty-five times more than the visible short in ETFs.
The thesis of this article is simple: the corralito is not a visible collapse. It is a regulatory framework built layer by layer between 2024 and 2026 that traps even synthetic sales — anonymous exits, derivative hedges, offshore bearish bets — of large sovereign holders. And the supreme irony: it was designed by the same government that has been promising "free markets" for decades.
"The Argentine corralito of 2001 was done with emergency decrees. The American corralito of 2026 is done with 'financial stability' regulations. The difference is only the presentation PowerPoint."
This analysis — a direct continuation of The 'Stealth Exit' (January 8, 2026) — dissects the complete mechanism: from updated short interest data to the regulatory map that turns the "stealth exit" into a high-risk operation. There is no sensationalism here. Only data, current regulations and their logical consequences.
I. The Short Record: The Biggest Bearish Bet in History
If in 2020 someone had told a sovereign bond manager that by 2026, 23% of the float of the largest long-term American debt ETF would be bet against it, they would probably have prescribed a vacation. In 2026 that is the daily landscape, and no one seems scandalized. Normalization of the apocalypse, they call it.
The TLT — iShares 20+ Year Treasury Bond ETF — is the reference instrument for any analysis on risk perception in long-term American debt. With an AUM of approximately $50 billion and 492 million shares outstanding, it is the thermometer of institutional temperature on 20-year or longer Treasuries. And that thermometer, in March 2026, is reading fever.
Definition: Short Interest
The Short Interest (short interest or short position) is the total number of shares of a security (or ETF units) that have been sold short and have not yet been returned or covered by the sellers. Measuring short interest allows estimating the level of structured bearish pressure on an asset.
How does short selling work? An investor borrows shares from a broker, sells them at the current price, and waits for the price to fall to buy them back cheaper and return the loan, pocketing the difference. If the price rises instead of falling, the investor loses.
Key short interest metrics:
% of Float Shorted: short shares ÷ shares outstanding. >20% is considered extremely high and a signal of strong institutional bearish conviction.
Days to Cover (DTC): short shares ÷ average daily volume. Indicates how many days it would take shorts to close their positions without adversely moving the market. High DTC = greater squeeze risk.
Short notional: short shares × current ETF price. Measures the capital bet in real monetary terms.
In the U.S., short interest in ETFs is reported every two weeks (bi-weekly FINRA reports). The settlement date is T+1. Data is public and accessible via MarketBeat and FINRA.
Source: FINRA — Short Selling · SEC Rule 13f-2Definition: TLT — iShares 20+ Year Treasury Bond ETF
The TLT (NASDAQ ticker: TLT) is the BlackRock/iShares Exchange Traded Fund that replicates the ICE U.S. Treasury 20+ Year Bond Index, investing in U.S. Treasury bonds with maturities of 20 years or more. With ~$50 billion AUM and 492 million shares outstanding (March 2026), it is the world's most liquid long-term fixed income ETF.
Why it matters as a barometer: Any large holder of long-term Treasury bonds who wants to hedge their interest rate risk — or simply bet against them — can do so through TLT without needing to move a single physical bond. TLT acts as a liquid proxy for the 30-year Treasury bond.
Arbitrage mechanics: Authorized Participants (APs) create and redeem TLT shares by delivering/receiving the underlying bond baskets. This mechanism keeps the ETF price near its NAV (net asset value). A high FTD (Failure to Deliver) would signal that someone cannot deliver the underlying bonds — indicating real liquidity stress.
Source: iShares.com — TLT Product Page · MarketBeat TLT Short InterestNow, with the terms clear, let's look at the data with historical perspective. At the start of 2025, TLT had between 86 and 100 million short shares. Already elevated. In December 2025 it hit a historical peak of 150.5 million short shares — equivalent to 27% of the float. Since then, short interest has fallen slightly to 120.75 million (13/03/2026), but IEF and SHY have risen to compensate. The total accumulated in the three main ETFs remains between 163 and 167 million shares.
📊 Table 1 — Short Interest in Treasury Bond ETFs (13/03/2026)
| ETF | Duration | Short Shares | % Float | Change vs. previous | Notional (USD) | DTC (days) |
|---|---|---|---|---|---|---|
| TLT | Long (>20y) | 120,751,947 | 23.27% | −4.3% | ≈ $10.45B | 2.4 |
| IEF | Intermediate (7-10y) | 23,946,436 | 4.9% | +24.6% | ≈ $2.29B | 1.9 |
| SHY | Short (1-3y) | 19,846,804 | 6.79% | +12.2% | ≈ $1.64B | 3.3 |
| Others (SHV, TBIL, VBIL, iBonds) | Ultra-short | <1M c/u | <1.4% | Volatile/low | <$0.15B | — |
| TOTAL ACCUMULATED | ≈ 164.5M shares | — | — | ≈ $14.38B | — | |
📊 Table 2 — Accumulated Short Interest Evolution (TLT + IEF + SHY) 2025-2026
| Report Date | TLT (shares) | IEF (shares) | SHY (shares) | Accumulated | Approx. Notional | Note |
|---|---|---|---|---|---|---|
| End 2024 / Jan 2025 | ~86-100M | ~5-10M | ~25-30M | ≈ 120-140M | ≈ $10-12B | 2024-2025 base level |
| 15/12/2025 | 150,497,343 | — | — | ≈ 190M+ | ≈ $16.5B+ | 🔴 TLT historical peak |
| 31/12/2025 | 142,980,341 | ~15-18M | 22,693,718 | ≈ 180-185M | ≈ $15.8-16.2B | 🔴 Accumulated year-end peak |
| 15/01/2026 | 131,082,564 | 20,808,924 | 16,007,603 | ≈ 167.9M | ≈ $14.91B | High in January |
| 30/01/2026 | 128,842,157 | 22,460,064 | 12,606,078 | ≈ 163.9M | ≈ $14.43B | — |
| 13/02/2026 | 135,514,940 | 17,531,973 | 12,689,078 | ≈ 165.7M | ≈ $14.91B | TLT 26.1% of float |
| 27/02/2026 | 126,114,074 | 19,221,948 | 17,687,155 | ≈ 163.0M | ≈ $14.80B | Recent TLT max |
| 13/03/2026 ◄ TODAY | 120,751,947 | 23,946,436 | 19,846,804 | ≈ 164.5M | ≈ $14.38B | IEF+SHY rise, TLT falls |
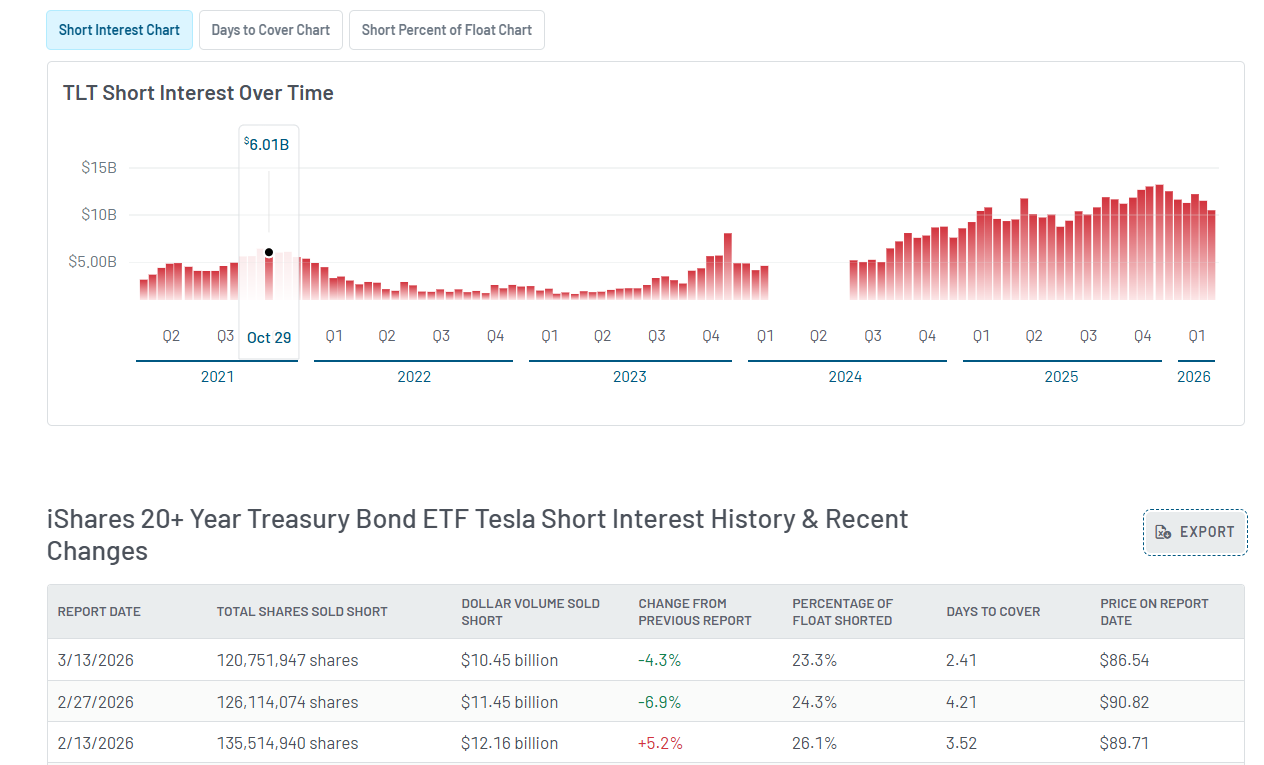
📈 Interactive Chart — Accumulated Short Interest Evolution (TLT+IEF+SHY) 2024-2026
"TLT short interest multiplied by 1.5–2 in just 12 months. These are not isolated speculators. They are institutions leaving through the emergency exit, quietly, without detonating the market they still hold on their balance sheets."
What does this mean in scenario terms? It means that $14.38 billion in notional are currently bet against the American bond through three main ETFs. But — and here is where it gets interesting — that number is only what appears in official records. What comes next is the iceberg below.
Verified data — MarketBeat (13/03/2026)
IEF records a +24.6% increase in short shares vs. the prior period (13/03 vs 27/02/2026). SHY +12.2%. While TLT falls -4.3%, the rotation of the short towards intermediate maturities signals sophistication: those reducing long exposure (TLT) are moving the bet to the middle of the curve (IEF/SHY).
II. The Synthetic Short: The Iceberg the U.S. Wants to Make Visible
If you believed that the $14.38 billion bet in ETFs is the whole story, you would be settling for the tourist menu. The full menu — the one read by those who really know what is happening — is written in three languages that the average investor does not speak: long-term options, total return swaps (TRS) and dark pools. Together, these three markets can multiply the real selling pressure on the American bond between 20 and 55 times compared to what appears on MarketBeat.
Definition: Synthetic Short
A synthetic short (or synthetic short position) replicates the economic behavior of a classic short sale without needing to borrow the underlying asset. It is built by combining derivatives that result in negative exposure to the asset's price.
Three main mechanisms:
Put/Call Options: Buying put options (right to sell at a fixed price) is equivalent to betting that the price will fall. If the put/call ratio in TLT options is 3:1 (three puts for each call), there is three times more synthetic bearish pressure than bullish. Market-makers who sell those puts must hedge by selling physical TLT — amplifying bearish pressure without it appearing in official short interest.
Total Return Swaps (TRS): Bilateral OTC contract where one party (client) receives any gain if the asset rises but pays if it falls — economic equivalent of holding the asset short. Does not appear in short interest data because it is not a share loan. European and Asian banks with large TRS books do not report to the SEC the same way as American managers.
Dark Pools: Private trading platforms where large institutions execute orders without showing them in the public order book. Dark pool sales are not recorded in real time. It is estimated that for every visible short share on NASDAQ, there is an equivalent of 3 to 5 times in OTC/dark pool derivatives. In 2026, with TLT in "trench warfare" mode, that multiplier could be at the upper end.
Practical estimate (March 2026): If the visible SI in TLT is 23.27% of the float, and the synthetic pressure multiplier via options (×2) and dark pools/swaps (×3-5 additional) is applied, the equivalent real selling pressure could be around 55–60% of the ETF's real float. In other words, more than half of the ETF is "bet against" in some form.
Source: SEC Rule 13f-2 (Form SHO) · CFTC TFF/COT Report · DTCC / NSCC AnalysisDefinition: Dark Pools and OTC Markets
Dark pools are alternative trading systems (ATS) where large institutions execute trades privately, outside centralized public markets such as NYSE or NASDAQ. They are not illegal — they are the standard mechanism used by large players to minimize the price impact of their orders.
OTC (Over-The-Counter) markets are those where two counterparties trade directly with each other without going through a centralized exchange. The interest rate swap (IRS), CDS (Credit Default Swaps) and TRS markets are OTC. They are regulated by ISDA (International Swaps and Derivatives Association) but have much less transparency than listed markets.
Why they matter in this context: A sovereign fund from the Middle East that wants to reduce its exposure to the American bond without detonating the market or appearing in official data can do so perfectly through an OTC swap with a European investment bank such as Société Générale or Deutsche Bank — banks that report to their local regulators under different rules than the SEC. The economic result is the same as selling: loss of bond exposure. The regulatory result is invisibility.
Source: SEC — Role of ATS in markets · BIS — OTC Derivatives Statistics⚡ The Anomaly Nobody Is Explaining: 27/02 → 13/03/2026
This is the data that should be in all financial headlines and that, with elegant discretion, mainstream media is ignoring. Between February 27 and March 13, 2026, TLT behaved in a completely counterintuitive way:
TLT Price
$90.82 → $86.54
Drop of $4.28 (−4.7%) in 15 daysTLT Short Interest
126M → 120.75M
Drop of −4.3% (speculators closing)Market logic says: if the price of an asset falls, those who bet against it win, so short interest should hold or increase (more people enter the victorious short). That short interest falls while the price collapses contradicts this logic in only one possible way: it is not the speculators who are selling — it is the physical bond holders (the longs) who are liquidating or hedging.
Market Intelligence Reading
When the price falls and short interest also falls, we are seeing the capitulation of sovereign longs. These are physical bond holders — possibly Gulf sovereign funds — transitioning from holding the physical bond (hold-to-maturity) to hedging or liquidating it via offshore synthetic derivatives. The visible short position in MarketBeat is not the attack. It is the visible collateral damage of a battle occurring below the surface.
📊 The Real Perspective: Futures vs. ETFs — The Size of the Elephant in the Room
To understand the real dimension of the bearish bet against the American bond, one must look beyond MarketBeat and read the CFTC's COT (Commitment of Traders) reports — the only complete X-ray of institutional positioning in the CME Treasury futures market.
Definition: COT (Commitment of Traders) and CFTC TFF
The COT (Commitment of Traders) report is a weekly CFTC (Commodity Futures Trading Commission) report that breaks down open positions in futures (and options on futures) by participant type. The specific report for financial markets is called TFF (Traders in Financial Futures) and classifies participants into:
Leveraged Funds (Hedge Funds / CTAs): Pure speculators. In the Treasuries market, they are systematically net short (bet that yields rise / bond price falls). They carry the largest "authentic short interest".
Asset Managers / Institutional: Portfolio managers, pension funds, insurance companies. Typically net long (maintain long duration for liability management). They counter the leveraged fund shorts.
Dealer / Intermediary: Dealer banks that make markets. Variable position depending on client flows.
Open Interest (OI) in Treasury futures (CME, March 2026): ~23-36 million contracts (historical record of ~36.3M in February 2026). Total estimated notional >$2-3 trillion. Leveraged funds are net short equivalent to $300-800B in notional — between 20 and 55 times the visible short in ETFs.
Source: CFTC COT Reports · CME Treasury Futures📊 Table 3 — Comparison: ETF Short Interest vs. Net Short Positions in Futures (March 2026)
| Instrument | Short / Net Short Notional | Scale vs. ETFs | Dominated by | Liquidity |
|---|---|---|---|---|
| ETFs (TLT + IEF + SHY) | $14.38 billion | Base (1×) | Institutional / ETF flows | Low (DTC 2-3 days) |
| Futures — Leveraged Funds | $300–800 billion (net) | 20–55× greater | Hedge Funds / CTAs | Very high (daily) |
| Futures — Total OI short side | Billions (half of OI) | Much greater | Mix specs + dealers | Extremely high |
🔬 The Reassuring Data Point (That Should Reassure Nobody)
Definition: FTD (Failure to Deliver)
A Failure to Deliver (FTD) occurs when the seller of a security (shares or ETF units) cannot deliver the instrument to the buyer within the standard settlement period (T+1 in the U.S. since May 2024). FTDs are monitored by the SEC under Reg SHO regulation and published in public lists every two weeks.
What do FTDs mean in a bond ETF? In ETFs, most FTDs are "operational" and arise from the creation/redemption mechanics of units by Authorized Participants (APs). They do not necessarily indicate "naked shorting" (selling without having). However, persistent and high FTDs (>5% of volume for more than 5 consecutive days) would put the ETF on the FINRA/SEC "Threshold List" — a serious signal of liquidity stress.
Key TLT data (26/02/2026): FTD = 12,600 shares (~$1.13M at ~$89.91 price). With 492M shares outstanding, it represents less than 0.003% of the float. It is practically zero. SCHQ records 108 shares. BND has days with 0 FTDs.
The uncomfortable interpretation: Low FTDs in a market with 23% of the float shorted are not a sign of health — they are a signal that someone is providing artificial liquidity. The Fed and primary dealers are buying everything the shorts and sovereign funds are selling. It is a covert rescue of bond market liquidity, not a freely functioning market.
Definition: Basis Trade — The Catastrophe Arbiter
The Basis Trade (or "cash-futures basis trade") is a widely used quantitative arbitrage strategy among hedge funds that exploits small price differences between the physical Treasury bond (cash market) and the corresponding Treasury future (CME). In theory, it is a market-neutral strategy: long in the physical bond, short in the future.
The leverage problem: The price difference (the "basis") is fractions of a cent, so hedge funds amplify it with massive leverage (50:1, 100:1 or more) via the repo market. This makes the strategy neutral in directional terms but extremely fragile to liquidity shocks. A sharp move in the basis can trigger margin calls that force disorderly liquidations — exactly what happened in March 2020 (the "dash for cash" that forced the Fed to intervene with $1.6 trillion in QE).
Relevance in March 2026: The Basis Trade is estimated to represent 45-50% of the visible short interest in TLT. Those positions are not bearish by conviction — they are leveraged arbitrageurs who, if forced to close, become massive TLT buyers (potential short squeeze). With Open Interest at historical highs (~36.3M contracts in February 2026), a disorderly unwind would be the largest short squeeze in bond market history.
Source: Federal Reserve — Cash-Futures Basis · BIS — Hedge Funds in Treasury market"For every visible dollar bet against the American bond in ETFs, there are between 20 and 55 invisible dollars in futures and OTC derivatives. The American bond market is the largest financial battlefield on the planet — and the referee (the Fed) is quietly buying so the game is not suspended."
Continue to Part II — The Regulatory Corralito
Part I dissected the iceberg: visible short interest and invisible synthetic pressure. Part II enters the heart of the corralito: the regulatory framework built between 2024 and 2026 (SEC Rule 13f-2, DTCC haircuts, REPO Act, IEEPA) and the geopolitical blackmail of former petrodollar allies trying to exit through the back door.
⚡ The Corralito in American Bonds Has Portfolio Consequences
120M short shares in TLT, invisible synthetic sales and a structural Bear Steepener. This is the exact environment for which the TSC Full Market MeltDown portfolio was designed: structural volatility, asymmetric inflation and collapse of the exorbitant privilege.
Read the Full Series Offline
Download the complete Hormuz Theorem EPUB for free — both parts in a single file. Read it on your e-reader, tablet or phone, without ads and offline.
Includes Part I and Part II · EPUB format · Compatible with Kindle, Kobo, Apple Books and more📋 Official Sources — Part I
Short Interest — ETFs
COT / Futures / FTD
Regulatory Frameworks