The Deflationary Mirage
How the market discovered —too late— that the most expensive narrative of the 21st century was an illusion
In March 2026, three simultaneous signals have broken the narrative: the BEIR curve screams inflationary shock at 5 years, bond vigilantes have bled the long end in just five days, and the DXY —strong as always abroad— cannot hide that the dollar a citizen holds in their pocket is worth 30% less than fifteen years ago. Immaculate disinflation was a fairy tale. And now comes the bill.
The Work We Thought Was Done
There is a phrase central bankers love to say at press conferences after raising rates: 'the work is almost done.' It is a phrase laden with institutional optimism. It is also, as March 2026 demonstrates, the most expensive phrase a central bank can utter.
The Federal Reserve said it in 2024. The ECB repeated it in 2025. Both believed it. Markets believed it. Fixed income portfolios believed it. And now, as the Breakeven Inflation curve marks its 5-year peak —above the 2% target on a sustained basis—, as the 30-year bond bleeds toward 5% in just one week, and as the dollar devours 30% of the purchasing power of the American middle class over fifteen silent years, it becomes clear that the work was not done.
The deflationary mirage is over. This article is the forensic analysis of how it happened. In three acts. Without concessions.
«The guard drops exactly when it is most needed. That is 'the last mile'. And that is what is happening right now.»
🇺🇸 The Last Mile Trap: United States
Imagine you've spent two years climbing an ice mountain with a ice axe. The wind has died down. The slope has eased. And a hundred meters from the summit, you decide to put away the ice axe because 'you've almost arrived.' That is exactly what the Fed and the ECB did between 2024 and 2026.
Between 2022 and 2024, the Fed executed one of the most aggressive monetary tightening campaigns in decades. Fed Funds moved from practically 0% to 5.25%. The result was as expected: CPI plummeted from its historic highs of 9% to the 2.5%-3% range. An apparent victory. A victory the market rushed to celebrate before the game was over.
The Fed, confident, began cutting rates in 2024. By early 2026, Fed Funds had dropped to 3.7%. The ECB, with an economically weaker Eurozone, cut even more aggressively to 2.2%. Everything seemed under control. The soft landing narrative was at its peak. The market was uncorking champagne.
The problem: inflation doesn't work like a faucet. It doesn't fully open and then fully close. It has phases. And the final phase —the last mile— is always the most treacherous. That's when the guard drops. That's when central banks make the fatal error of believing they have won.
📚 Definition: What is the BEIR Curve?
The BEIR —Breakeven Inflation Rate— is the most precise thermometer for measuring what the bond market really expects inflation to do in the future. It is not a survey or an analyst's opinion: it is the money bet by the most sophisticated investors on the planet.
It is built by comparing two types of American Treasury bonds: Nominal Bonds (fixed coupon, independent of inflation) and TIPS — Treasury Inflation-Protected Securities (coupon that automatically adjusts with real inflation). The difference between the yields of both is exactly what the market expects inflation to be during that period.
Short BEIR (1Y-2Y): Measures imminent inflation expectations. Reflects current momentum.
Medium BEIR (5Y): The most watched. A peak here signals expected structural supply shock. The Fed monitors it obsessively.
Long BEIR (10Y-20Y): Measures the expected long-term inflationary regime. Sustained above 2%: the central bank's target is dead.
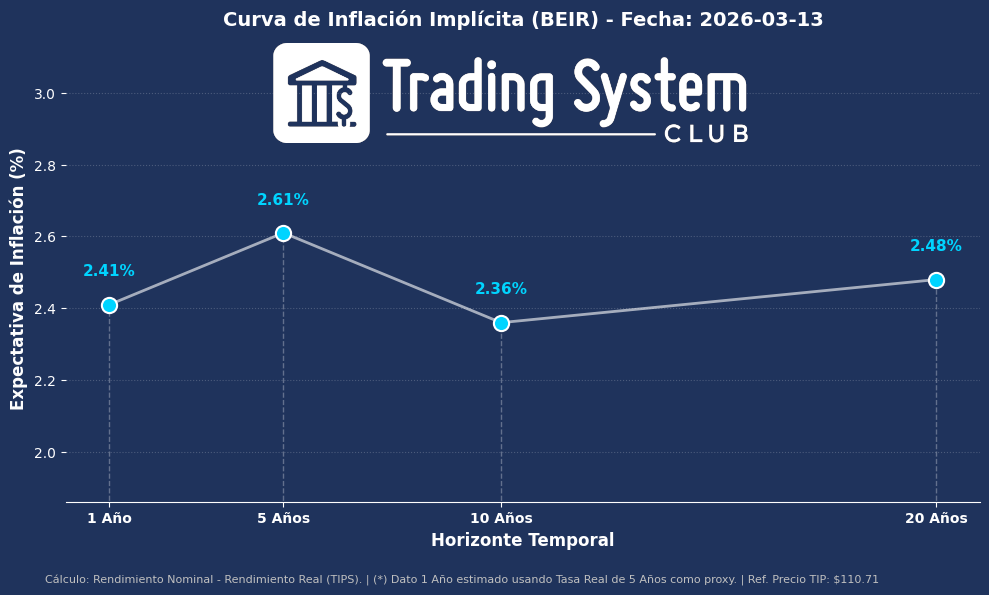
The BEIR Curve of March 13th: The Chart That Changes Everything
The BEIR curve of March 13, 2026 is not an academic chart. It is a verdict. Its hump shape —with the peak exactly at the 5-year tenor— has a very precise institutional reading: the bond market, the most sophisticated and best-informed market on the planet, does not believe inflation is today's or tomorrow's problem. It believes it is the next five years' problem.
Why five years? Because it is the exact horizon in which a supply shock like $90-$100 oil takes to fully filter through the real economy. Energy prices cascade: first to transportation, then to food, then to manufacturing, finally to services. The market is buying 5-year inflation protection because it knows what is coming.
The message from the long end (10Y and 20Y above 2.36%) is even darker: the 2% target is dead as a long-term anchor. We are heading toward a structural inflation regime between 2.3% and 2.6%. Not hyperinflation. But enough to destroy the real value of any fixed income portfolio without protection.

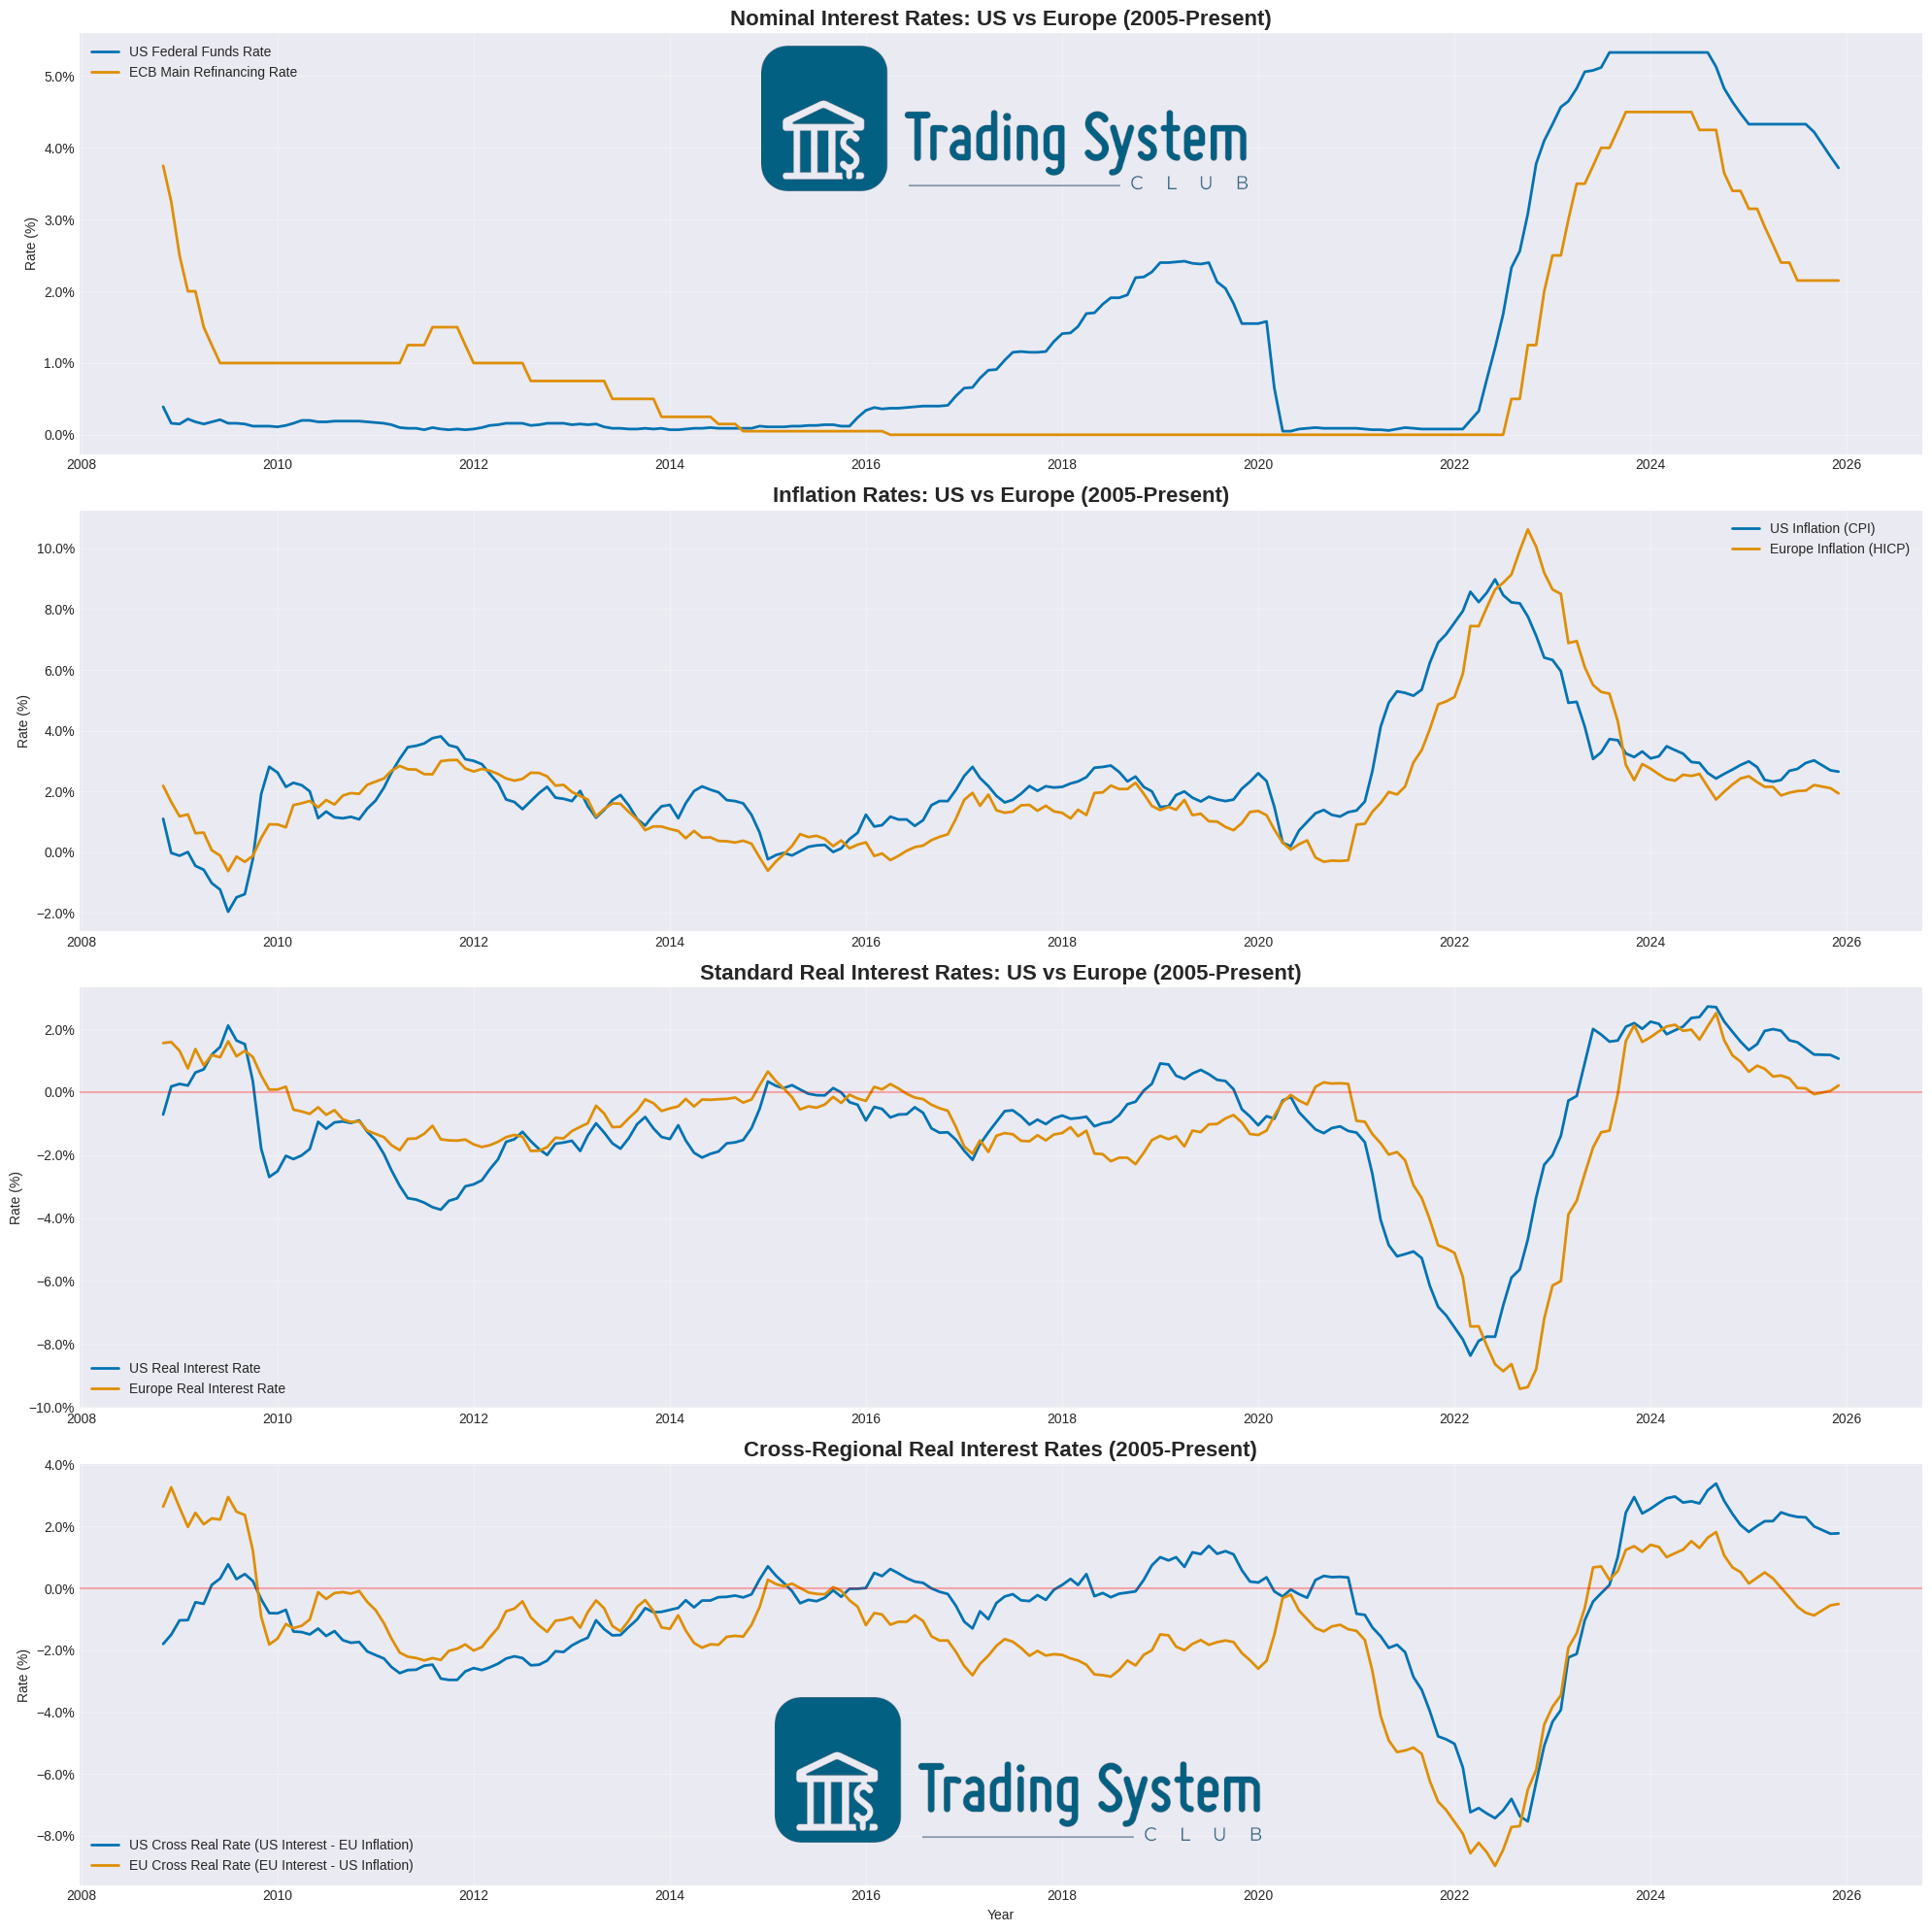
🇺🇸 vs 🇪🇺 The Real Rates Abyss
This is where the macro analysis becomes geopolitically brutal. The United States has a cushion: American real rates (nominal rates minus expected inflation) are in the +1.5% to +2% range. That means the Fed, even having cut rates, maintains an effectively restrictive policy. Capital flows toward dollar-denominated assets because they offer positive real returns.
Europe does not have that cushion. The ECB cut rates to 2.2% when inflation was touching 1.5%-2%. But if oil pushes European inflation to 3%-4%, the European real rate will fall to zero or negative. And that is where the nightmare begins.
«The last mile of disinflation is always the most treacherous. The guard drops exactly when it is most needed. The BEIR curve of March 13 is not a technical chart: it is the market telling the Fed it sang victory too soon.»
The Anatomy of Panic in 120 Hours
How long does it take the world's largest market to panic? The answer, according to March 2026 data, is exactly 120 hours. Five days. That is how long it took institutional investors to move from complacency to alarm.
The 'Structure & Momentum' chart of the American yield curve on March 13, 2026 is an involuntary masterpiece of financial terror. The gap between the dotted grey line (5 days ago) and the thick cyan line (today) is brutal:
3.60%
No movement. Fed trapped.3.87%
Violent repricing.4.28%
Hemorrhage.4.91%
Touching the 5% critical threshold.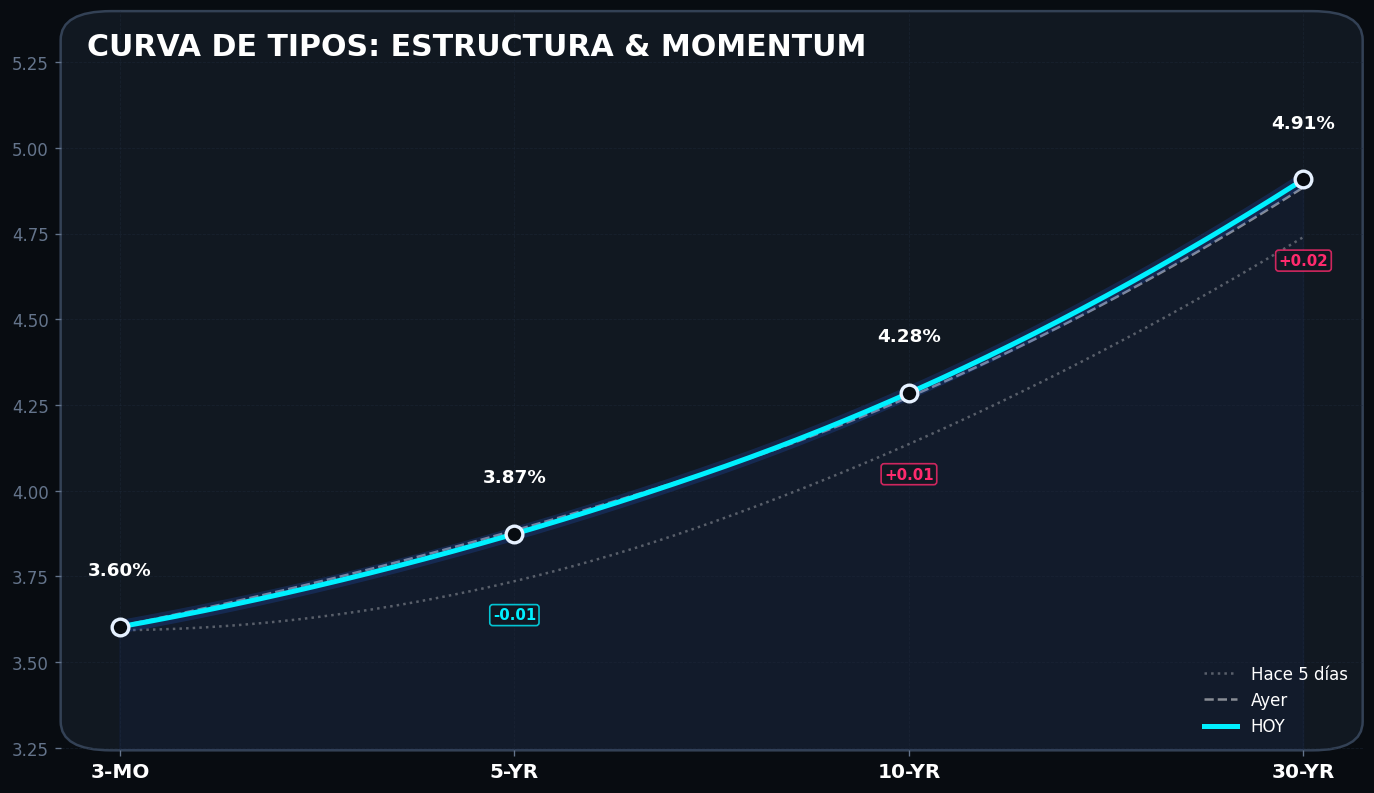
The total spread between 3M and 30Y has widened +13.9 basis points in 5 days. In fixed income market language, that is brutality. It means investors are suddenly demanding much more risk premium for lending long-term. And the market is not pricing healthy growth: it is pricing a structural inflationary shock.
📚 Definition: What is a Bear Steepener?
A Bear Steepener occurs when long-term interest rates rise much faster than short-term rates. The name comes from 'bear' (bearish for bonds: when yields rise, prices fall) and 'steepener' (the curve steepens). It is the most feared movement by fixed income portfolio managers.
Bull Steepener: Short rates fall. Signal of expected cuts → positive for risk assets.
Bear Steepener (TODAY): Long rates rise. Signal of structural inflationary shock → negative for ALL assets.
Bear Flattener: Short rates rise (restrictive Fed). Signal of anticipated recession.
⚔️ The 4 Fronts of Bear Steepener Destruction
Mortgages Spike
Fixed-rate mortgages reference the 10-year bond. When it rises, the housing market freezes.Corporate Credit
Companies finance long-term. Corporate spreads widen. Refinancings become more expensive.P/E Ratios Compress
Higher discount rate = lower valuation. Growth stocks (tech) are most exposed.Government Debt More Expensive
The US Treasury refinances debt at higher rates. The fiscal deficit self-reinforces.📚 Definition: Bond Vigilantes
The term was coined by economist Ed Yardeni in the 1980s to describe large institutional investors who punish a government's poor fiscal or monetary policy by massively selling its debt. By selling bonds, prices fall and yields rise, making the government's financing cost more expensive until it changes policy.
«Before I wanted to reincarnate as the president or the Pope. Now I want to reincarnate as the bond market, because then you can intimidate everyone.» — James Carville, Clinton advisor
Condition 1: Persistent inflation (non-transitory energy shock)
Condition 2: Fiscal indiscipline (uncorrected post-pandemic deficits)
Condition 3: Central bank with hands tied (cannot lower rates)
Checkmate: Why the Fed Cannot Win This Game
The analysis of this act is devastating in its logical simplicity. The Fed has three options. None of them good.
If the Fed cuts rates:
Inflation, already rebounding due to $90-$100 oil, receives a fuel injection. Inflationary expectations become unanchored. The 5Y BEIR, already at 2.61%, could scale toward 3% or more. The Fed's anti-inflation credibility, built through pain between 2022 and 2024, evaporates.
If the Fed holds rates:
The Bear Steepener continues. The 30Y keeps climbing. Credit suffocates. Stock valuations compress. The housing market freezes. Growth decelerates. And the financial system starts to crack.
«In 120 hours, the bond market has destroyed the soft landing narrative. Bond Vigilantes have returned and are doing exactly what they have been threatening to do for thirty years: punishing governments that believed they had won before the game was over.»
The Third Twist: The Enemy Was Inside
There is a literary technique called the knife twist. It consists of revealing, in the final act, that the enemy was not outside. It was inside. The inflation coming from Iranian oil is the visible enemy. The invisible enemy —the one that has been confiscating wealth for fifteen years while the official narrative celebrated dollar strength— are the central banks themselves and the superpower's own fiscal policy.
The third act of this story is not about Iran. It is about Washington. And about the bill someone will have to pay.
📚 Definition: What is the DXY (US Dollar Index)?
The DXY measures the relative value of the US dollar against a basket of six currencies: euro (57.6%), Japanese yen (13.6%), British pound (11.9%), Canadian dollar (9.1%), Swedish krona (4.2%) and Swiss franc (3.6%). It does not measure real purchasing power. It does not measure whether the dollar buys more energy, food or housing. It only measures whether the dollar is worth more than other fiat currencies.
Strong DXY IS useful for: Suffocating emerging economies indebted in dollars. Exporting deflation to Europe. Attracting capital to Wall Street.
Strong DXY is NOT useful for: Protecting the purchasing power of the citizen in Ohio. Buying more energy at the pump. Paying less at the supermarket.
The Perfect Crime: The Confiscation Wedge
This is the most uncomfortable section of the analysis. Because it doesn't talk about Iran. It doesn't talk about the bond market. It talks about an economic policy decision that was made consciously and that has a politically incorrect name that no one in the establishment utters.
The silent tax.
Since 2020, American inflation has systematically diverged from its historical trend. The pandemic fiscal policy, massive debt monetization and subsequent energy shock have generated what the chart elegantly calls a 'Trend Deviation.' Let us call it by its name: it is the largest wealth transfer in recent history from savers and the middle class to debtors —the largest debtor in the system being the American State itself.
When inflation erodes the nominal value of debt, the State pays its bonds with dollars worth less than they were when they were issued. It is a covert haircut. Legal. Systematic. And extremely effective. Nobody called it a tax. Nobody voted for it. But everyone is paying it.
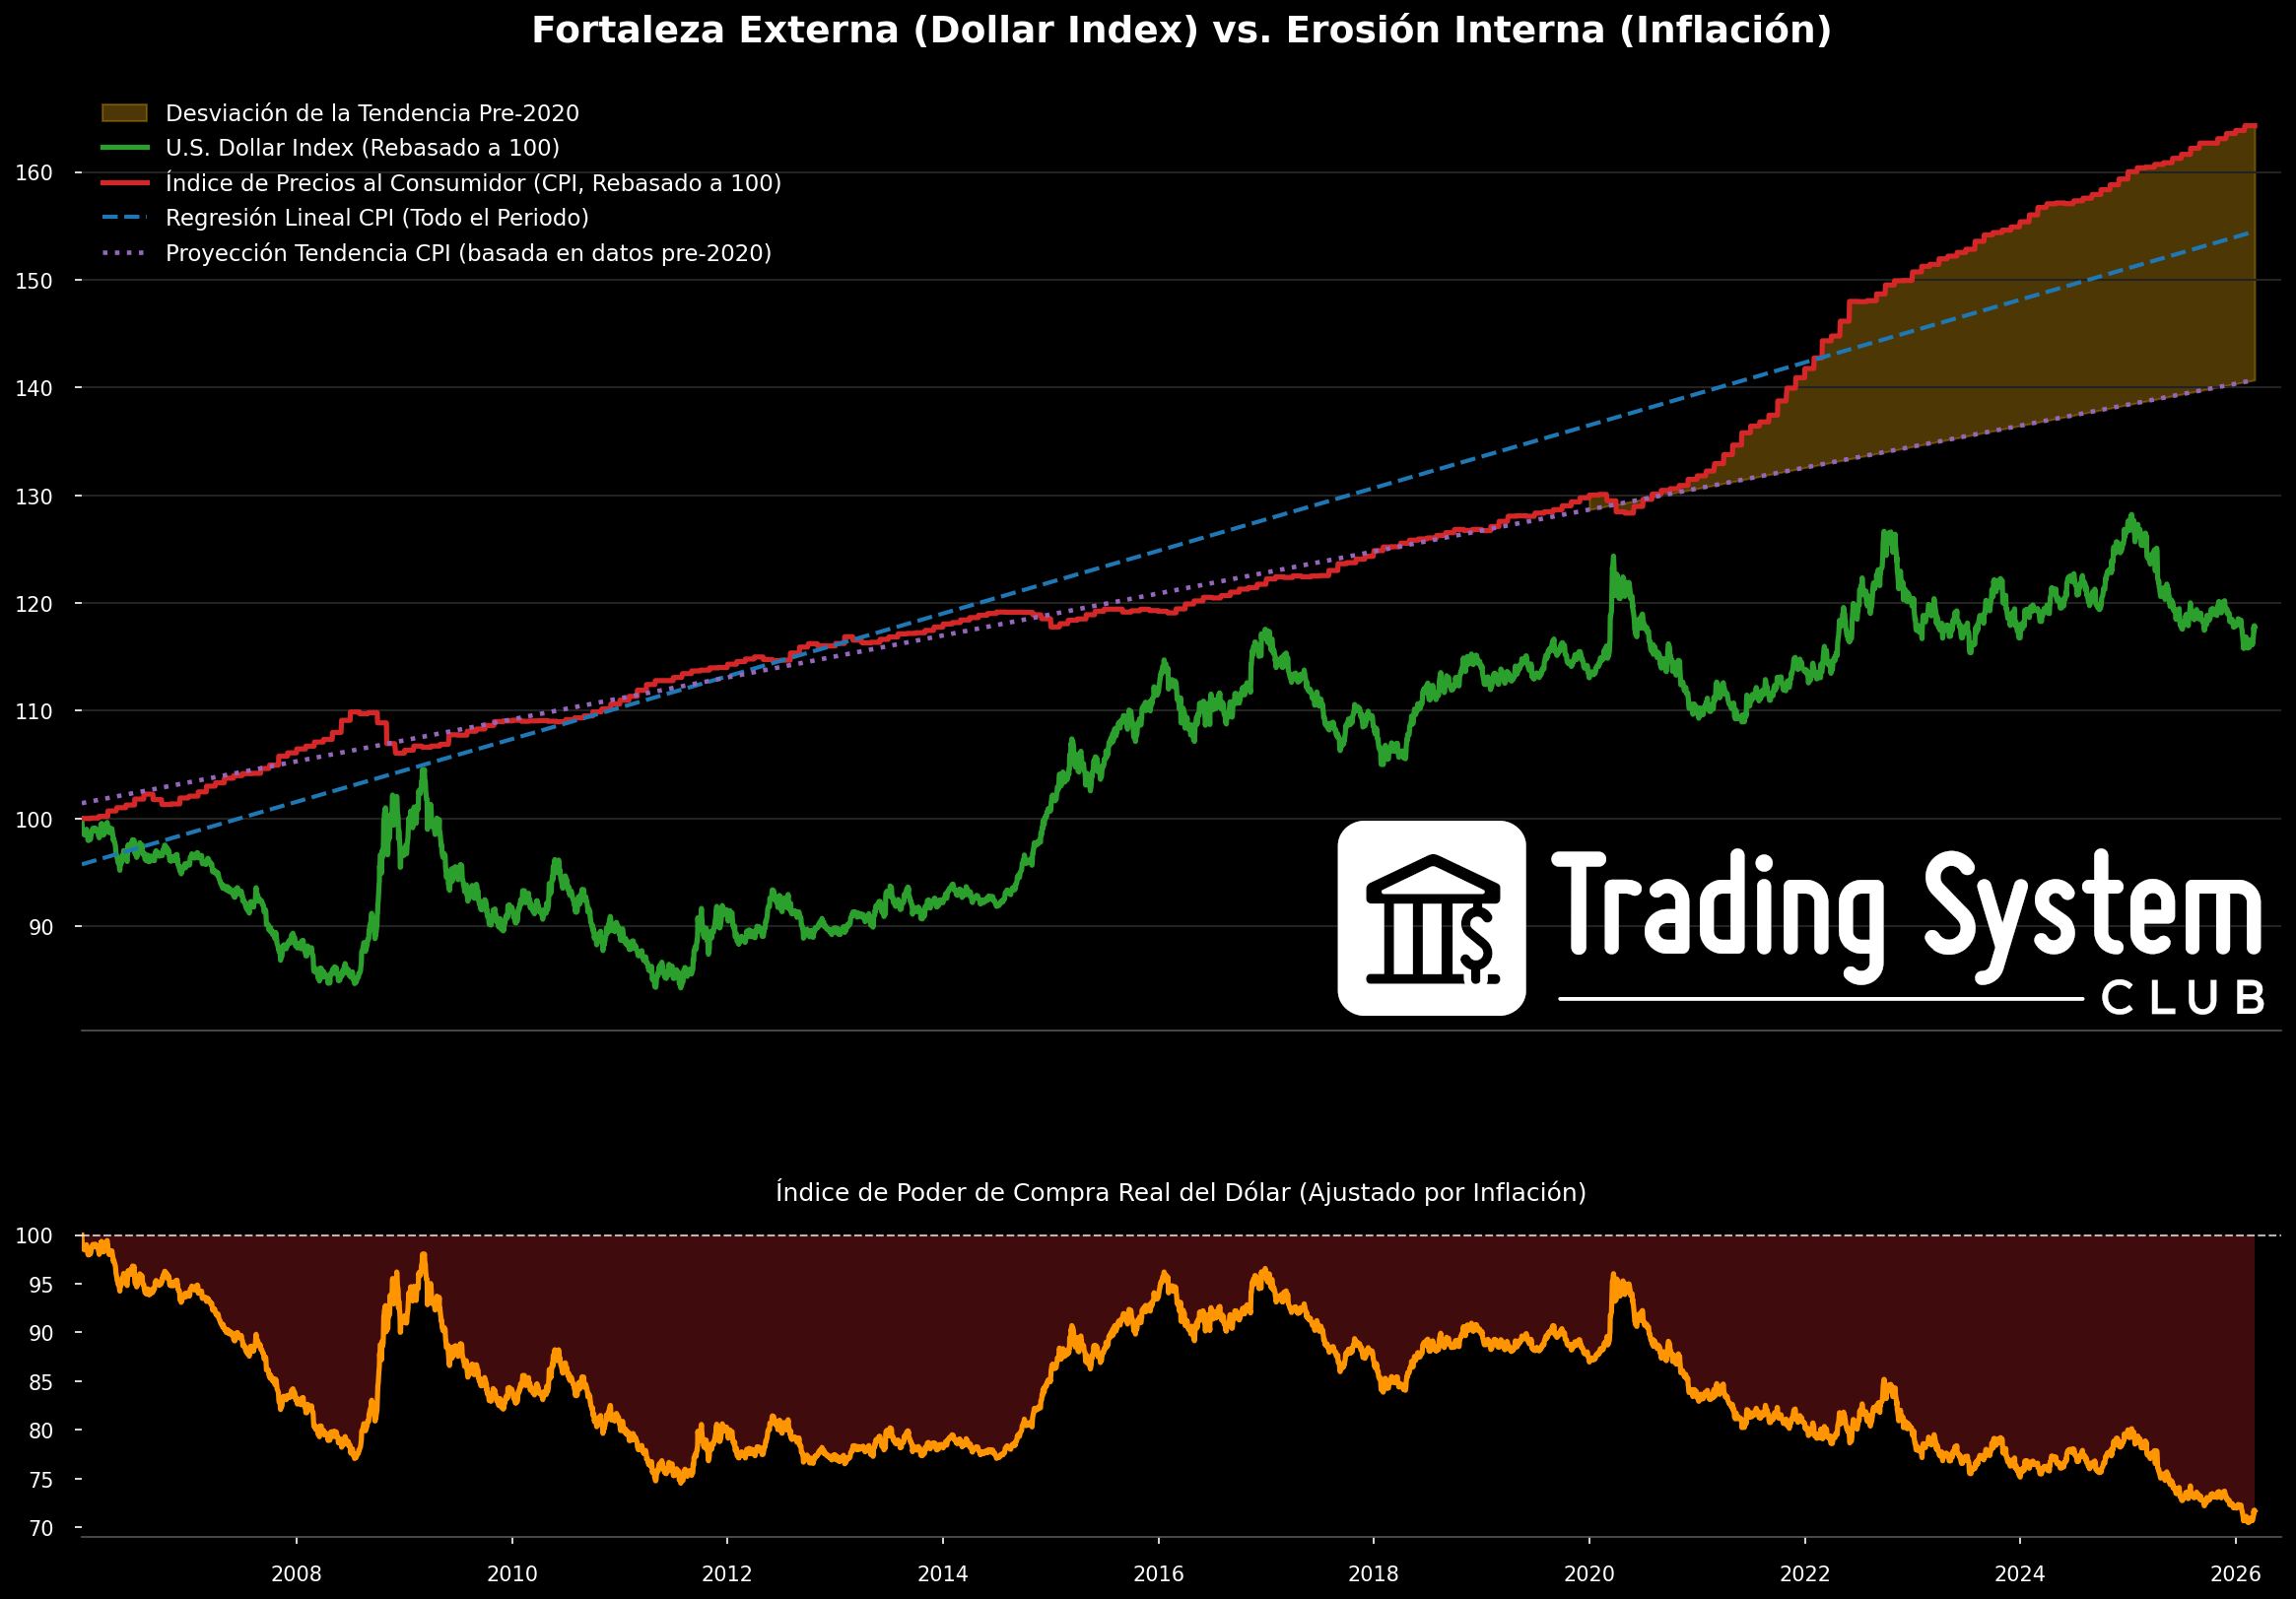
The Accounting Misery: Base 100 → Level 70
Numbers don't lie even if the official narrative tries. Taking dollar purchasing power at base 100, in 2026 that index sits at levels close to 70. A 30% loss of real value. And most of that collapse —the steepest slope— has occurred between 2020 and 2026.
To understand what that means in concrete terms: the same $100 bill that in 2010 paid for a basic basket of goods and services, in 2026 pays for approximately $70 of that same basket. The difference has been absorbed by accumulated inflation. And that difference doesn't show up in the DXY. Doesn't show up in Fed press conferences. It shows up in the bank statement of someone who earns in dollars and pays their bills in dollars.
With oil at $100 per barrel and the BEIR curve signaling sustained inflation over the next five years, the orange line of real purchasing power is not going to recover. It is going to continue breaking through supports.
«The United States has achieved the feat of having a strong currency abroad and a trash currency at home. The DXY is strong. Real purchasing power is at level 70 out of 100. Marble on the outside. Termites inside.»
Conclusion: The Potemkin Facade
The analysis that closes this article is not a pessimistic conclusion. It is an anatomical description of a system that works exactly as it is designed to work. The problem is that this design has two different beneficiaries: the American State (which liquidates its debt with inflation) and the American citizen (who pays the bill in the form of eroded purchasing power).
In the context of March 2026 —with oil at $100, the BEIR screaming 5-year inflationary shock, bond vigilantes bleeding the long end, and real purchasing power below level 70— the image that emerges is of a system that has reached the limit of its own internal contradiction.
The question the intelligent investor must ask is not 'Will inflation fall?' The right question is: 'Who will pay the bill, and with what assets can I protect myself in the meantime?'
«The deflationary mirage is over. The market knows it, the BEIR curve screams it, bond vigilantes execute it, and the citizen's bank account feels it. The question is no longer whether inflation will return. The question is who will pay the bill. And history tells us it is always the same person: whoever has paper savings and no real assets.»
— Quantitative Strategy Team, Trading System Club · March 2026⚔️ The Three Scenarios for the Rest of 2026
Macro analysis is useless if it doesn't end in concrete investment decisions. These are the three possible scenarios, their implied probability in the options market, and the appropriate positions for each.
| Scenario | P(Market) | Oil | Fed | Equities | Refuge |
|---|---|---|---|---|---|
| A — Contained Shock | 30% | Falls to <$80 | Resumes 2026 cuts | Growth Tech rebound | Tech, Long bonds |
| B — Persistent Shock | 50% | Stable $90-$100 | Pauses cuts all 2026 | Gradual P/E compression | Gold, TIPS, Energy, USD |
| C — Hormuz Escalation | 20% | Exceeds $120 | Possible rate hike | S&P 500 -20%+ fall | Full MeltDown, Gold, USD, Cash |
Full Market MeltDown
Long VIX · Short Index · Long GOLDThe BEIR curve screams structural inflation. The Bear Steepener destroys fixed income portfolios. If the Strait of Hormuz escalates, the S&P has an appointment with -20%. The Full Market MeltDown portfolio combines Long VIX, short indices, and a long Gold position to turn that nightmare scenario into a managed position. Don't wait for the 30Y to cross 5%. Protection isn't expensive when the market is already telling you what's coming.
Institutional Management · +1M AUM
The BEIR curve and the Bear Steepener are not early warning signals: they are signals that arrive when the adjustment has already begun. Institutional managers need systems that detect the regime change before it is reflected in prices. Our algorithms track TIPS flows, positioning in 30-year bond futures, and sector rotations in real time.